
Box 3 Old vs. New Taxation Systems: A Comparison
Taxes
/Old vs New Box 3
/In December 2021 the Dutch supreme court ruled that the way returns are currently taxed in box 3 violates property rights. The Dutch government set to work on a replacement system, and most of us have anticipated the arrival of the new box 3 system with a sense of foreboding, convinced that it will most definitely be bad news.
The Dutch government has made an initial bare-bones proposal for a replacement box 3 taxation system.
In today’s post we are going to compare the old and new box 3 taxation systems and attempt to answer the question: is the new taxation system more onerous than the existing one? Was our pessimism justified or were our misgivings misplaced?
A summary of the old (a.k.a. existing) box 3 system
Under the current system of box 3 taxation, your portfolio is assumed to make a certain return every year. This imaginary percentage of return is determined by the belastingdienst (a.k.a. the Dutch IRS) and bears no relation to reality. There are various brackets - and the amount of the imaginary return depends on the bracket into which your portfolio falls. The return assumed in the highest bracket in 2022 is 5.53%.These imaginary rates are used to calculate an imaginary gain and you are taxed at the rate of 31% on these imaginary gains.
If you would like to take a closer look at the existing system in all its glory, we have a box 3 tax calculator with a ‘show me the math’ option. Open the kimono and enjoy the full monty!
The key word for the existing system is imaginary - the amount you are taxed has no relation to real world gains or losses. This means that if the stock market is up 20% you are still taxed as if it only went up 5.53% (or less, if you are in a lower bracket!). Conversely, if the stock market loses 10%, you are still taxed as if it went up by 5.53%.
One good thing about the existing box 3 system is that the imaginary rates allow for predictability - you can easily model the effect of box 3 taxation on your portfolio and plan accordingly.
What is the new box 3 system?
In the new proposed box 3 system we are going to be taxed on both actual and unrealized gains, instead of imaginary ones. The Dutch term for this is *vermogensaanwasbelasting*
The plan that has been proposed is: in box 3 the capital gains of your portfolio will be taxed on an annual basis. You will be taxed whether or not you actually realize your gains.
An example:
On January 1st your portfolio is worth €200,000. Your investments do well and on December 31st your portfolio is worth €214,000. Your portfolio has seen a capital gain of €14,000. This is your unrealized (i.e. you have sold nothing; all your gains are on paper) return for the year. You will owe box 3 taxes on these gains.
Of course, this was the simplest possible example. In real life you may have acquired more shares/units of ETFs during the year, you may have sold a part of your portfolio etc., and those transactions will be taken into account.
At a glance, it is obvious that you could end up paying much more in taxes under this scheme - because you are paying taxes based on the actual performance of your portfolio. A possible advantage of the new scheme is that they state that some provision will be made to allow you to offset your (possibly unrealized) gains with your (also possibly unrealized) losses .
What this means is that if in year 1 you have unrealized losses of say €10,000, and in year 2 you have an unrealized gain of €15,000, then in year 2 you should only owe taxes on €5000 because you carried forward your losses.
They have not yet clarified the rules of carrying over losses (e.g. how long will you be allowed to carry forward a loss?). Many other details of the new proposal are also unknown - e.g. what will the tax rate be? Will there be a single rate or progressive rates?
Assumptions
- We assume that the box 3 tax rate remains the same as it currently is: 31%.
- The draft proposal states that the current tax-free allowance (€50,650 per fiscal partner in 2022) will be replaced by a tax-free return amount. We will assume that you can make a gain of €2801 (per fiscal partner) tax-free. We multiplied the current tax-free allowance of the old system with the current imaginary return value to get this number.
- For simplicity, we assume that losses are carried over to cancel out future gains until they are depleted. It is unlikely that this will end up being the case, but as you will see below this is not an overly optimistic assumption for the purposes of this post, because in the cases that I studied, the loss was never carried for more than 7 years before it was depleted.
- For simplicity, we assume the USD:EUR conversion rate is 1:1.
Comparing the new box 3 system to the old box 3 system
- Assume a starting portfolio value.
- Assume a period of time (typically 60 years).
- Model the growth of the portfolio for 60 years assuming that each year we pay box 3 taxes.
- At the end of the 60 year period we compare the values of the portfolio under both the new and the old box 3 taxation systems and then declare a winner.
SPOILER ALERT: If you have your money on one of these horses, you are in for a surprise. Neither tax scheme won every case study!
Let the games begin!
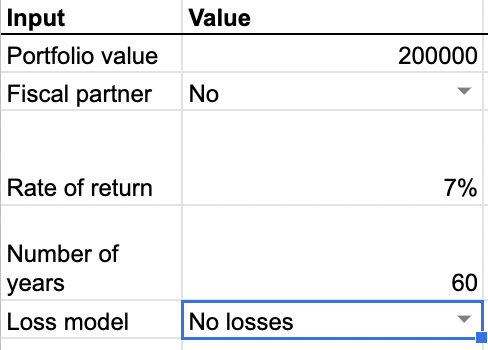
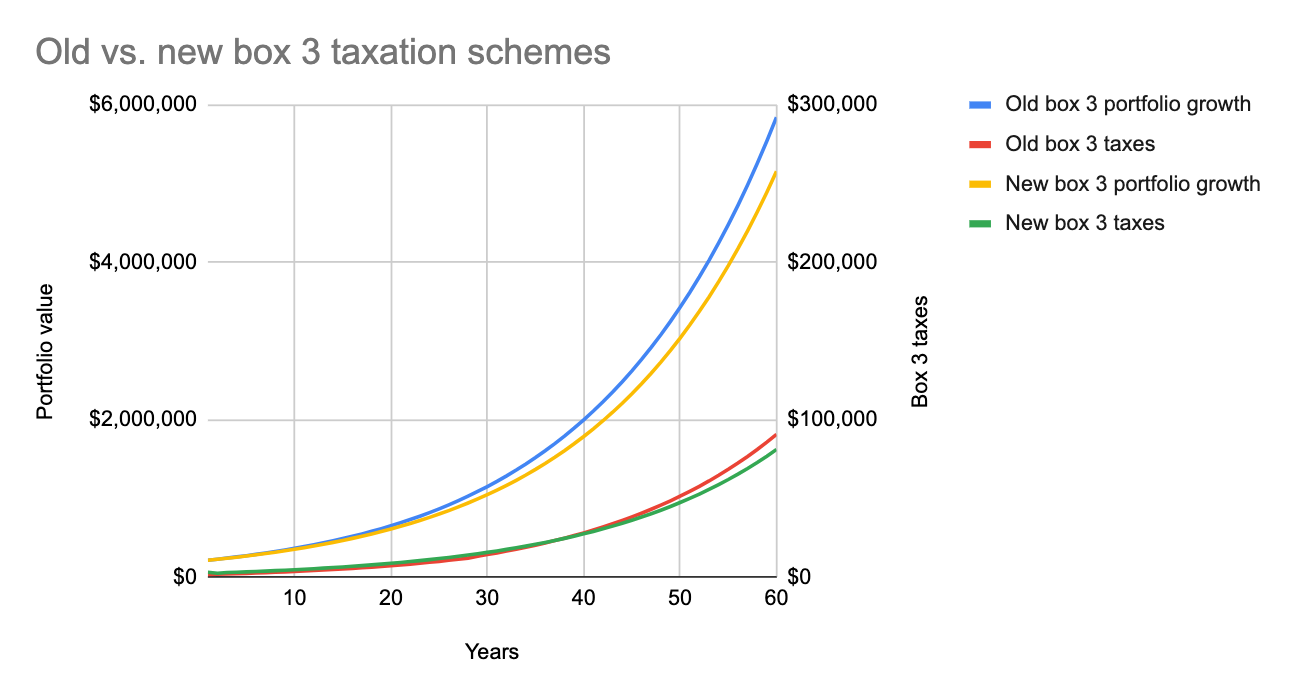
Case study 1: The Baseline - Only Gains
We assume the market returns an average of 7% (which just happens to be the historical average of the S&P 500, adjusted for inflation) over our simulation period of 60 years.
The old box 3 system yields a portfolio that is 14% larger than under the new box 3 system.
Case Study 2: Let’s throw some losses in there
The newsletter links to the excel sheet used to generate these results. Sign up here to get access!
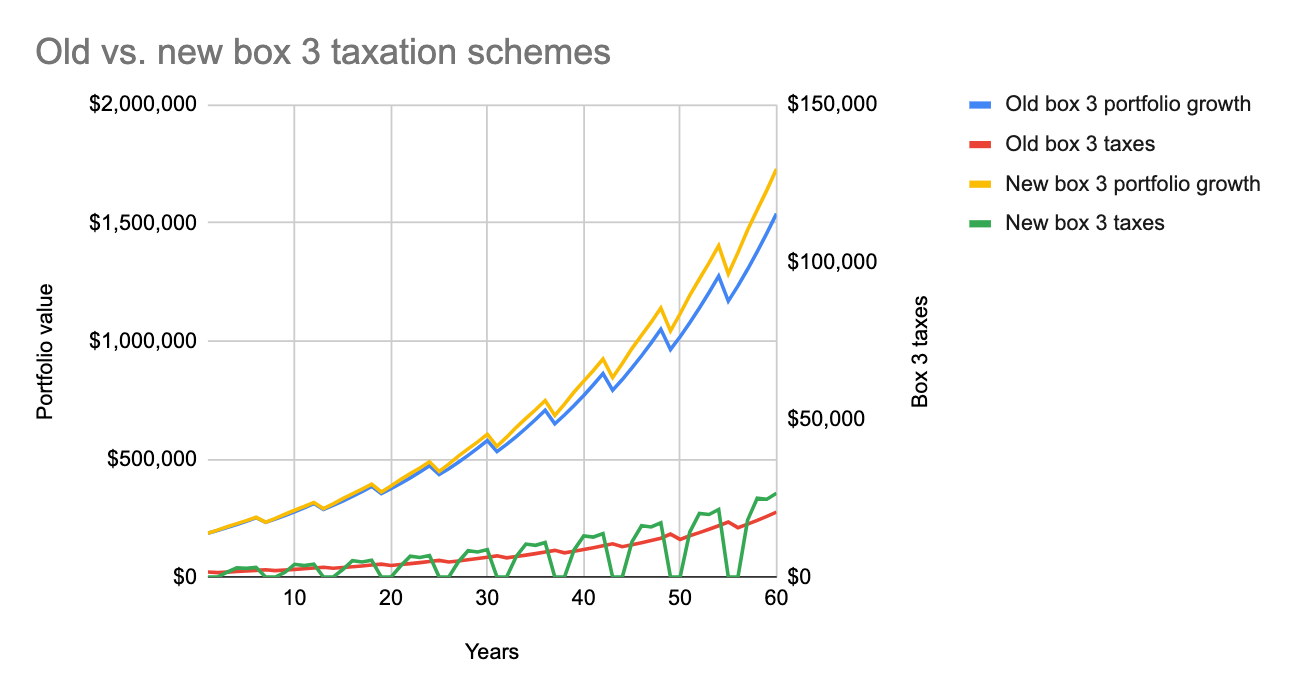
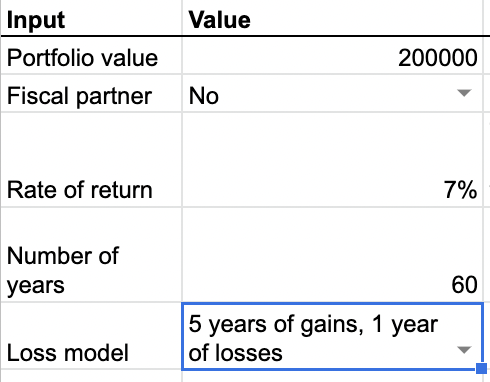
Case 3: Gain:Loss ratio mimicking the S&P 500

The new system yields a portfolio that is a whopping 28% larger than the old scheme.
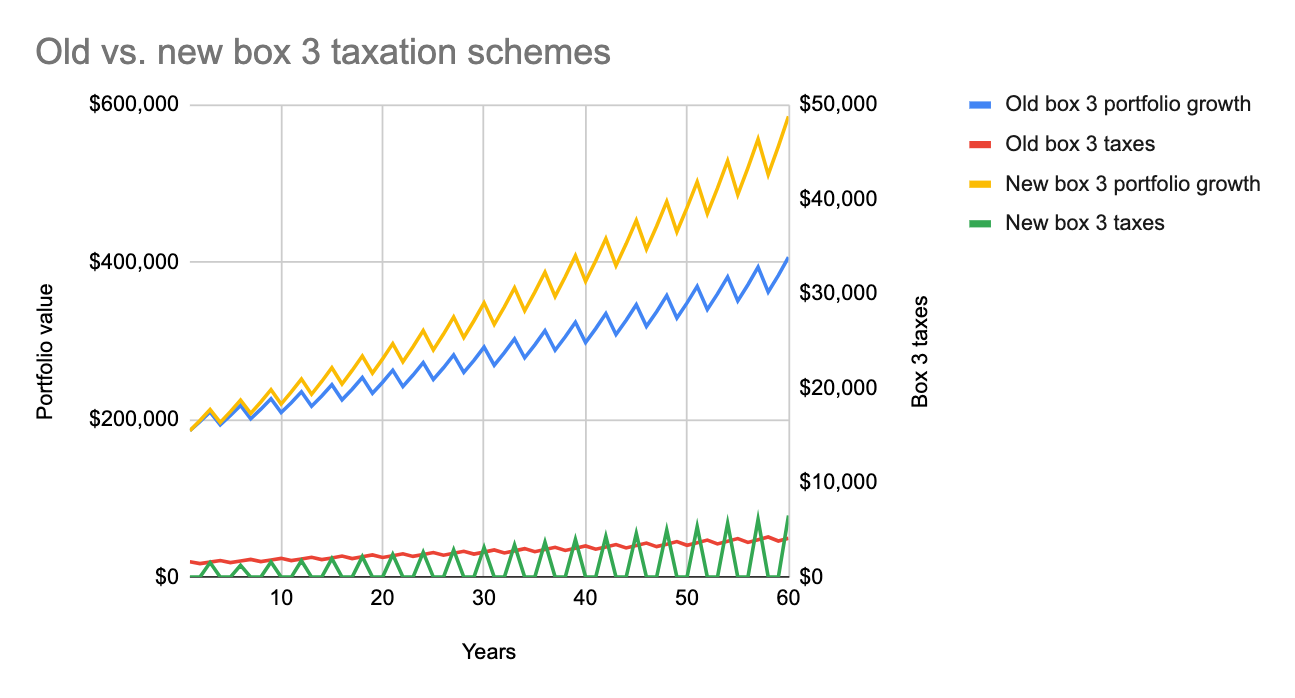
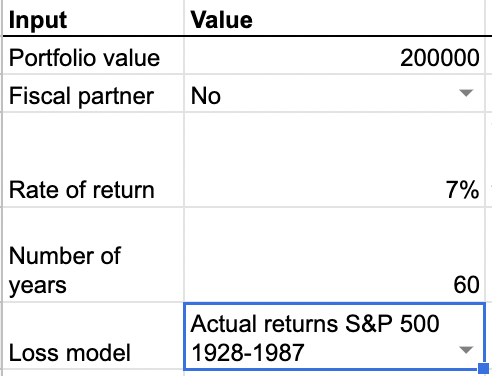
Case Study 4: Actual historical returns 1928 - 1987
There is a sharp downward curve at the start of the portfolio graph representing 4 years of negative returns from 1929 - 1932 (including a whopping -47% in 1931). Under the old box 3 scheme the effect of these years at the start of the simulation is to deplete the portfolio enough that the portfolio slipped into the lowest bracket where the imaginary return is a mere 1.15%! These early years of very low taxation made the old system behave in a way that is similar to the new system with its years of 0 taxes due to loss carry over. This allowed the old scheme to ‘catch up’ with the new one in a way that was not possible in case study 3.
For those who are curious I will note that if you start with even a slightly larger portfolio (e.g. $220,000), this case study results in a draw between the two systems. With an even larger starting portfolio (e.g. $500,000), the new box 3 system handily beat the old one.
So the order of gains and losses (also called the sequence of returns) has a big impact on the portfolio performance. On to the next case study!
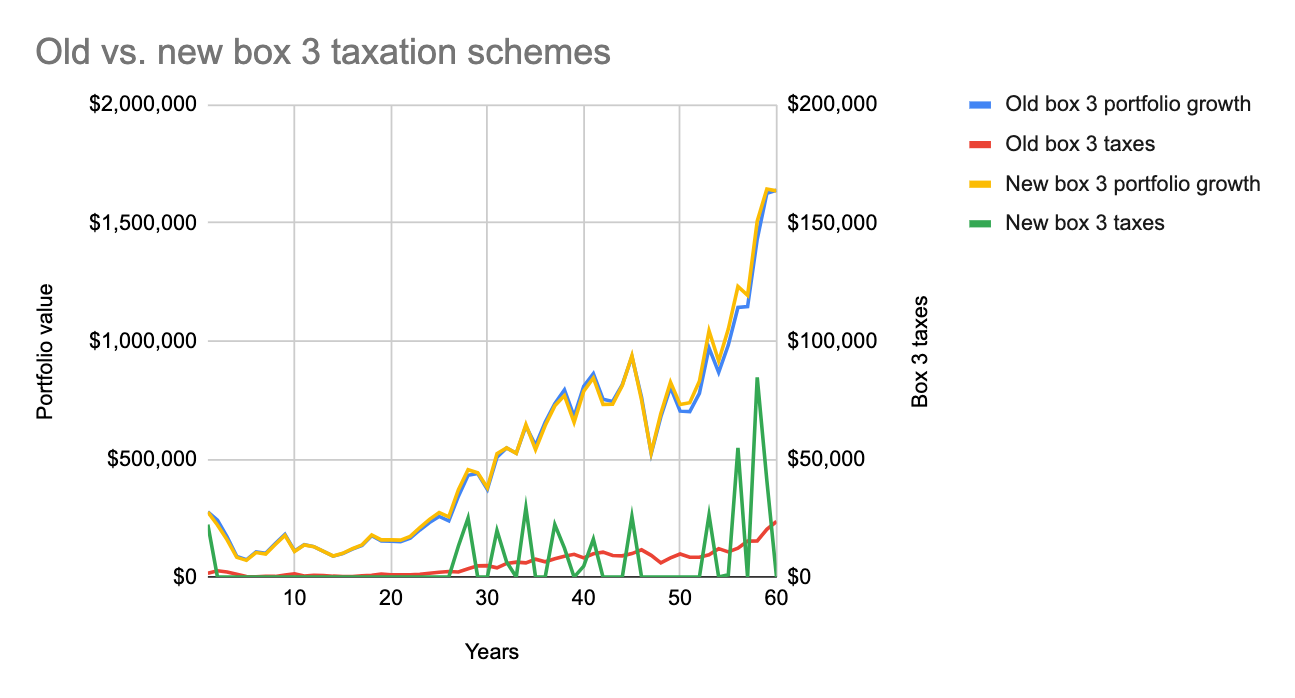
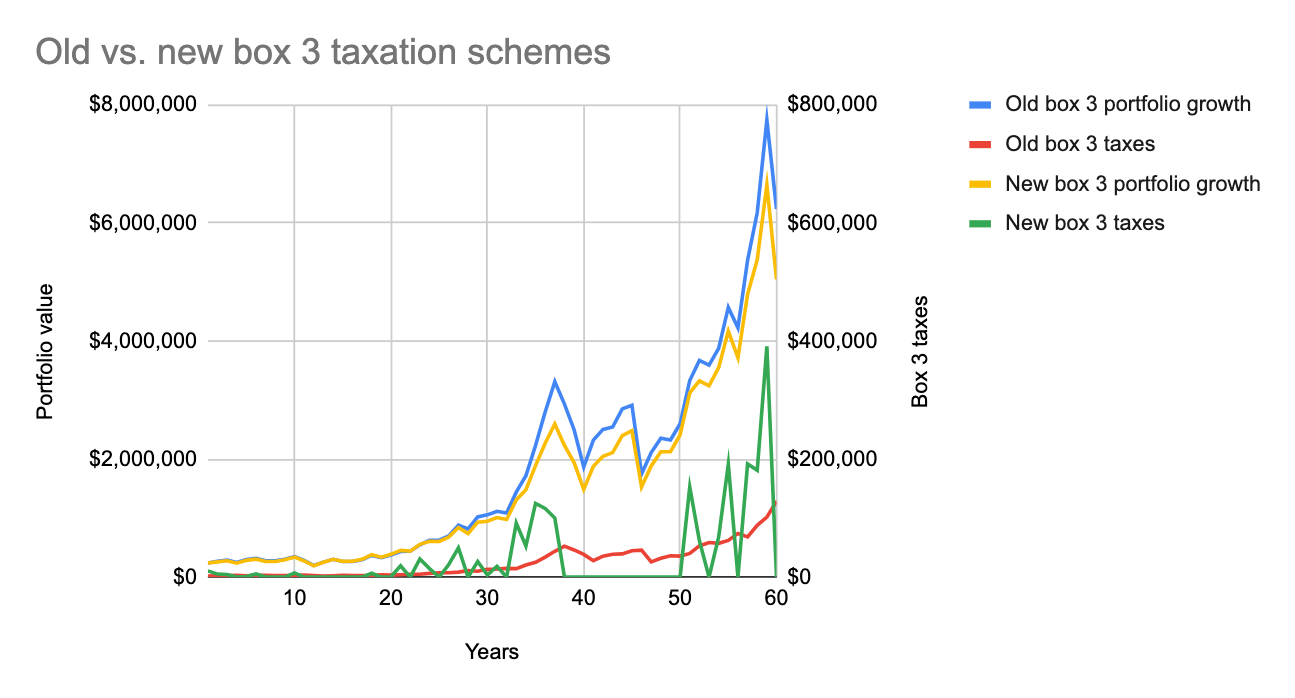
Case Study 5: Actual historical returns 1963 - YTD 2022
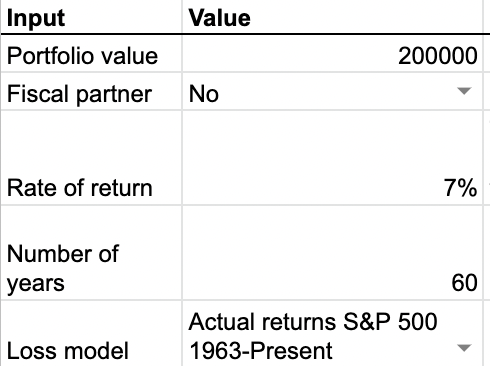
The old box 3 system yields a portfolio that is 21% larger than the new system.
Customizing the Case Studies
I created a spreadsheet that I used to generate the results in this post. The spreadsheet allows you to modify the input parameters like portfolio size, rate of return etc. The American Burger newsletter links to this spreadsheet, allowing you to perform your own portfolio experiments. Sign up here to get access!
Conclusion
I confess to being one of those who had my money on the new scheme being a perpetual loser, so I was pleasantly surprised that this was not the case. I must, of course, remind you that these results were all based on the assumptions we made. If the tax rate ends up being higher than 31% or the tax free allowance much lower, or the loss carryover limited to a couple of years, the new tax scheme will obviously not perform as well as it has in this post. Though the details will change some principles remain.
If you are invested in the stock market, the performance of the new box 3 system is going to depend on the sequence of returns that we see for the next few decades.
If we have the ‘usual’ ratio of gains:losses, the new box 3 system will stand a chance of costing about the same as the old system.
If we happen to live through a period of abysmal returns we can comfort ourselves with the fact that thanks to the new system we have paid less taxes than we would have under the old system.
If we are fortunate enough to live through a charging bull market, we will pay a ton more in taxes, but we can wipe our tears with our currency while doing our Scrooge impersonation in the money pit of our large portfolio.
All in all, there does not at this time seem to be the need to pack our bags and stampede out of the Netherlands post-haste.
For those of you with an appetite for more, here is some interesting reading: how the various policital parties view the new box 3 system and what each party will be pushing for or against.
Coming Up
Of course, as soon as we know more details about the new box 3 system, I will redo the case studies and update the spreadsheet to reflect reality. I will also be writing about a tool that you can use to simulate the chances of your portfolio surviving your retirement. Not only does this tool run simulations using historical returns, it is also possible to simulate box 3 tax payments. If you want to be notified of these exciting events, head over to the contact page to sign up for the newsletter!